A Toroidal Ocean of Water

WaTor
by James J. Lemon Graphics
©2005 All Rights Reserved.
Free
Software
download
WaTor v.2, mac OS 7.x-9.x PowerPC executable.
The
download: It's a *.sit (Aladdin Stuffit) archive containing:
1)
waTor v.2 executable (MacOS7.x-9.x)
Just
expand and run, if you like it, please send an email to admin@jjlg.com.
Somewhere there exists a very simple world called WaTor, populated with three interrelated
and competing species, in a seemingly endless but finite environment of open
water and scattered rocky outcroppings.
Plankton basks and thrives in the sunshine, converting solar energy into food for numerous
small fish, which in turn are gobbled up by large, voracious sharks. The plankton
provides excellent hunting ground for the sharks, who prefer a thick blanket
of the stuff. Indeed the plankton attracts both fish and sharks, drawing them
inexorably into mortal struggle. Fish love the plankton but every thicket potentially
hides a prowling shark. There is nothing more comical than a shark bereft of
its normal plankton blanket, robbed by a school of (snickering) fish. Sharks
prevent a population explosion of fish, which indirectly benefits the plankton,
giving the shark or its progeny a better place to hunt. Fish are caught between
starvation from overgrazing their local plankton, and overpopulation which tends
to attract marauding bands of sharks.
The world of WaTor is not very far away; only as far as the nearest Macintosh. A
modest ocean has been set up and the species are intensely competing. A well-meaning
humanoid from Terra keeps "twiddling" with the population birth rate, starvation
tolerance, and mixing of populations, draining and refilling the oceans, and
every so often restarting an extinct population, even resetting the universal
clock, freezing everything, or modifying Avogadro's number!
One might think this simple system would quickly "optimize" itself and exhibit a
stabilization of populations of plankton, fish and sharks. This is not so. The
populations vary wildly, heading for abrupt extinction, then miraculously recovering
to unprecedented levels of success, and all its problems. It remains "stable"
in a very unstable way, over wide ranges of species density. Will the humanoid's
settings be able to avoid sending the species into Armageddon? Is there a setting
which will produce everlasting harmony? Is sharkie birth control the answer,
or a new species of plankton? With your assistance as the Humanoid, we intend
to run a few experiments to answer these and other questions.
Ah, but first you need some training, you say? Very well. First, let's look at
the view of WaTor the humanoid has at his terrestrial control center. There
is a large screen, with a representation of the actual WaTor prominently displayed.
The WaTor Screen Layout
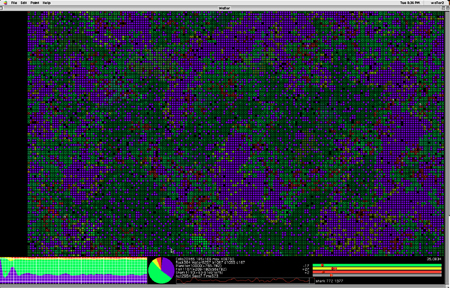
The screen consists of several subscreens, each with a particular function to perform.
Menu Bar
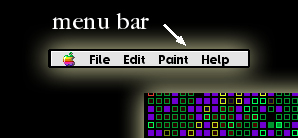
Use the menu bar to Quit, select a painting species, and otherwise control the simulation
and display.
The WaTor Ocean
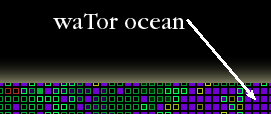
The area labeled "Ocean" is a map of the actual WaTor PanGlobal Ocean which is represented
as an array of cells.
A particular cell contains either:
 a rock,
  some water,
  a piece of plankton,
  a fish or
  a shark.
The
map has been flattened out on the display, but in reality the upper margin is
seamlessly connected to the bottom margin, and the right margin is connected
to the left. That is, a fish swimming upward (or rightward) off the screen will
reappear at the bottom (or the left) without even noticing it.
Rules of Existence and Coexistence
Time
is provided by the Universal Clock, during each tick (or Chronon) of which,
each cell of the WaTor Ocean can perform zero or more "actions" as defined by
the rules.
The
populations follow a very simple set of rules, as follows:
Cell
contents are exclusive, that is, a particular cell contains only one species
at a time.
Unoccupied space is filled with water, which appears blue on the map.
Rocks are immobile and inert. That is, they do not move, hunt or eat anything,
and do not die, but they do absorb space and break it up into more intimate
sub-spaces. Rocks appear as black spaces on the map.
Plankton is immobile. It brews in the open ocean, not particularly associated
with or anchored to rocks. Plankton grows by spreading or budding into adjacent
empty cells. The rate at which this happens is the Plankton Breed Rate. Plankton
does not die of old age, but is consumed directly only by fish. A cell space
consumed by a fish is then occupied by the fish, leaving an open water cell
behind. Plankton is represented by green on the map.
Fish are mobile, and consume as much plankton as possible. A fish will randomly
swim in open ocean, but when presented with plankton, will always prefer to
eat. If there is more than one adjacent cell containing plankton, the fish randomly
selects one and devours it. It will eat even at risk of its own life, hoping
all the while that any adjacent shark doesn't select it for dinner. If it hasn't
eaten by the time Fish Starve Limit Chronons of time has elapsed, it will die
and vanish, leaving behind only open ocean and memories. Fish are represented
by yellow on the map.For
surviving fish, there's a reward. Every "Fish Breed Rate" Chronons of time,
a fish can reproduce, provided, that is, that it finds itself next to at least
one cell of open water. This is not difficult since the little guys are like
lawn mowers, leaving behind lots of open ocean, perfect birth environment except
devoid of food for babies. There is only one "sex" of fish, the hermaphroditic
type, which just decides to give birth because it's old enough, and does so!
No bothersome fishie flirting or fishie foreplay! Perhaps someday there will
be a more sophisticated WaTor simulation which will simulate these interesting
aspects of reproduction.
Sharks are mobile fish consumers. Sharks prefer plankton to open ocean, and
simply push it aside while swimming and looking for a meal of nice tender ocean
fish. When no fish are around the sharks just mill about, ventilating their
gills. The sight of a fish sends the shark into a little "feeding frenzy", which
always leaves a patch of ocean even in the middle of plankton, and one very
happy hermaphroditic shark! Just like for the fish species, the sharks have
a Shark Starvation Limit beyond which the shark will die and leave ocean water
instead. Every
gestation cycle or Shark Breed Rate Chronons, a shark can give birth. As in
fish breeding, this must be done where there is an unoccupied spot of open ocean.
Wouldn't want to sacrifice any plankton! For this reason it is quite common
to see a brooding, pregnant shark eat a meal in order to provide its offspring
some living space. Sharks are represented by (what else?) a nice purplish red
shark color on the map.
Help for the Humanoid
All
of the species can be identified on the humanoid's map, by color and somewhat
by behavior. However it is a dizzying spectacle, so in order to help bring order
to this soup of existence, a number of numeric and graphic readout areas are
provided the miserable humanoid to ease his Godly drudgery. They are, in no
particular order:
The Main Statistics Panel
shows the current population census statistics (See Figure
3). The inverse fields indicate increment/decrement enabled fields. Clicking
the mouse when the cursor is positioned over the numeric field entry increments
or decrements the count (See Figure 3a), which will take effect at the next
Repopulation Event (See Breed and Starvation Panel below).
Water
shows the current number of "open ocean" cells.
Rocks
shows
the current number of Rockupied cells. Clicking on the number resets the default
beginning number of rocks.
Plankt
shows the current number of plankton cells.
Clicking on the number resets the default beginning number of plankton cells.
PBreed
shows
the number of plankton which were breeding in the previous chronon.
Fish
shows
the current number of fish cells. Clicking on the number resets the default
beginning number of fish.
FEat
shows
the number of fish which ate plankton in the previous chronon.
FBreed
shows
the number of fish which were breeding in the previous chronon.
FStarve
shows
the number of fish which died of starvation in the previous chronon.
Sharks
shows
the current number of shark cells. Clicking on the number resets the default
beginning number of sharks.
SEat
shows
the number of sharks which ate fish in the previous chronon.
SBreed
shows
the number of sharks which were breeding in the previous chronon.
SStarve
shows
the number of sharks which died of starvation in the previous chronon.
The
Breed and Starvation Panel shows and allows manipulation of the population control
parameters and the current Time (in Chronons, modulo 10,000). Clicking the mouse
when the cursor is positioned over the numeric field entry increments or decrements
the parameter. (If the cursor is more to the left, this decrements, and if the
cursor is more to the right, it increments.) The special field Time, when clicked,
resets the time counter and initiates a Repopulation Event, where the map is
cleared and the populations specified via the Main Statistics Panel are randomly
redistributed. From left to right, the parameters have the following interpretations:
PBrd
controls
the Plankton Breed Rate in chronons, that is, the number of chronons which must
elapse before a newborn plankton cell can reproduce.
FBrd
controls
the Fish Breed Rate in chronons, that is, the number of chronons which must
elapse before a newborn fish can reproduce.
SBrd
controls
the Shark Breed Rate in chronons, that is, the number of chronons which must
elapse before a newborn shark can reproduce.
FStv
controls
the Fish Starvation Limit in chronons, that is, the number of chronons after
which a fish will die without eating plankton.
SStv
controls
the Shark Starvation Limit in chronons, that is, the number of chronons after
which a shark will die without eating fish.
Breed
and Starvation Readouts
Barcharts
The Barchart 1 Panel shows
a) instantaneous fraction for each species, as well as the
b) positive or negative instantaneous rate of change.
Pie Chart
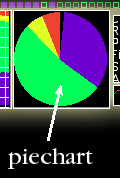
Piechart displays the instantaneous fraction of the species
Stripchart 2
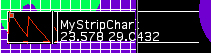
Stripchart 2 displays the same selected data as stripchart 3, except it is a fixed, smallish
size. This way, you can have an instantaneous readout of the selected parameter and still
use the long stripchart for a separate interval.
Stripchart 2 is switchable on/off with the small red rectangle in the upper left corner.
StripChart 3, Tabulation
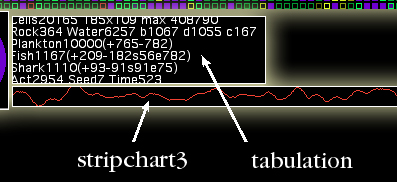
Stripchart 3 displays any selected parameter from the tabulation.
To select a different channel click on the name in the tabulation.
To see a longer stripchart, click and drag the tab in the upper right hand corner.
Microseconds per cell

For a benchmark of your CPU use this number carefully.
Gauges
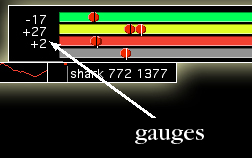
The gauges show the birth and death activity for each species.